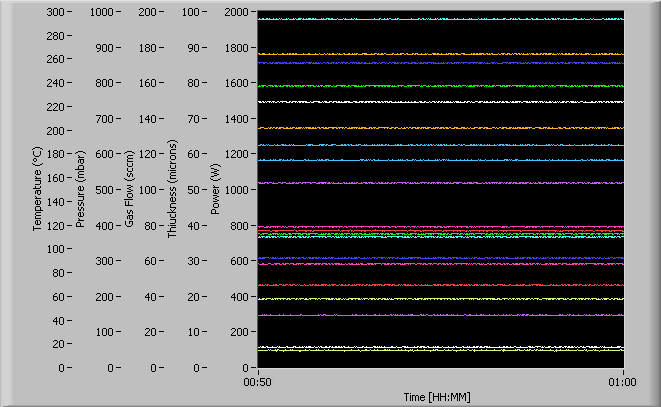

It’s confusing isn’t it?
LabVIEW Multiplot Master Toolkit gives you 3 much better ways of plotting and comparing many signals with different units and ranges – plus a range of other tools.
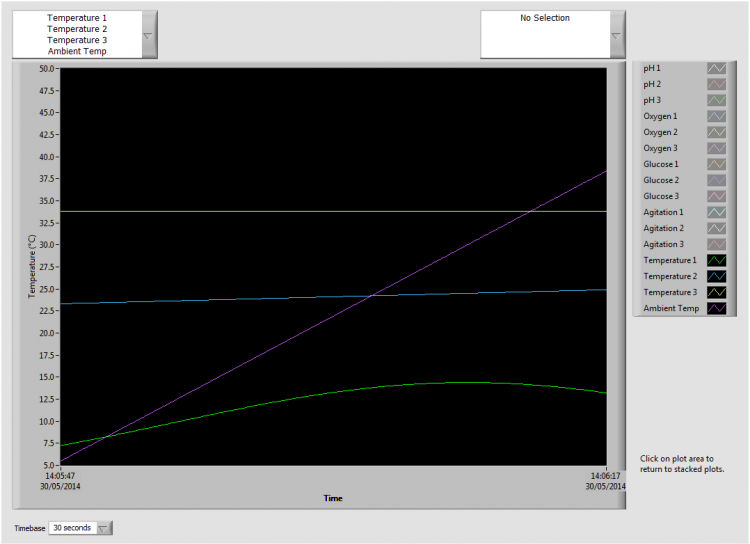
One of these 3 chart formats is shown below.
An intuitive configuration screen allows you to divide you plots into groups and then the 2 drop-down menus above the chart allow you to display either 1 or 2 groups at a time. For this particular format, clicking on the plot area allows you to toggle between this format and a stacked plot chart that shows all you plots with one plot group in each plot area.

Download your copy now from the Download LabVIEW Multiplot Master Toolkit

If you have any questions please contact us.